2
Qwen
新人贴
海光8卡 K100AI服务器运行官方的qwen3.5_vllm镜像推理加载超级慢。
2026-04-12 18:51:48
456
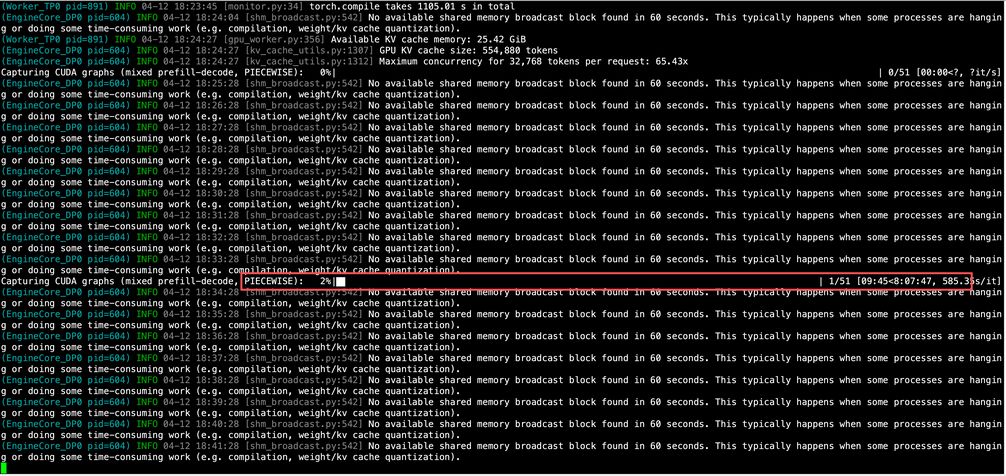
请官方技术支持回答: 海光8卡 K100AI服务器运行官方的qwen3.5_vllm镜像推理,加载模型:Qwen/Qwen3.5-122B-A,加载非常非常慢,正常吗? 完全加载完要一整天上班时间,对不对? 模型来源:https://hf-mirror.com/Qwen/Qwen3.5-122B-A10B 详细版本信息 ### DTK - 版本: DTK-26.04-rc4 - 构建时间: 2026年3月25日 16:05:35 CST - 安装路径: /opt/dtk → /opt/dtk-26.04/dtk-26.04 ### DCU驱动 (HYHAL) - 版本: 6.3.30-V1.4.1 - 构建时间: 2026年3月19日 19:05:36 - 安装路径: /opt/hyhal → /usr/local/hyhal - VBIOS版本: 所有8张卡均为 6.310.001200r.846907 - 内核模块: hycu, hycu-sched, hydrm_buddy, hydrm_ttm_helper, hyttm, hykcl, hy-extra 全部加载成功 启动代码如下: ``` docker run -it --rm \ --name vllm-qwen3.5-122b-bf16 \ --privileged \ --shm-size=200G \ --ipc=host \ --network=host \ --device=/dev/kfd \ --device=/dev/dri \ --cap-add=SYS_PTRACE \ --security-opt seccomp=unconfined \ --group-add video \ -v /opt/hyhal:/opt/hyhal:ro \ -v /mnt/model_ramdisk/:/model \ harbor.sourcefind.cn:5443/dcu/admin/base/custom:vllm015-ubuntu22.04-dtk26.04-glm5-0408 \ bash -c ' set -e echo "==== [1/3] 设置环境变量 ====" export HIP_VISIBLE_DEVICES=0,1,2,3,4,5,6,7 export ALLREDUCE_STREAM_WITH_COMPUTE=1 export VLLM_USE_PIECEWISE=1 export VLLM_USE_FLASH_MLA=1 export USE_FUSED_RMS_QUANT=0 export USE_FUSED_SILU_MUL_QUANT=1 export VLLM_USE_GLOBAL_CACHE13=1 export VLLM_FUSED_MOE_CHUNK_SIZE=16384 export VLLM_CUSTOM_CACHE=1 export VLLM_USE_OPT_CAT=1 export VLLM_USE_FUSED_FILL_RMS_CAT=1 export VLLM_USE_LIGHTOP_MOE_SUM_MUL_ADD=0 export VLLM_USE_LIGHTOP_RMS_ROPE_CONCAT=0 export VLLM_RPC_TIMEOUT=1800000 export VLLM_NUMA_BIND=1 export VLLM_RANK0_NUMA=0 export VLLM_RANK1_NUMA=1 export VLLM_RANK2_NUMA=2 export VLLM_RANK3_NUMA=3 export VLLM_RANK4_NUMA=4 export VLLM_RANK5_NUMA=5 export VLLM_RANK6_NUMA=6 export VLLM_RANK7_NUMA=7 echo "✅ 环境变量设置完成" echo "" echo "==== [2/3] GPU 状态检查 ====" rocm-smi || true echo "" echo "==== [3/3] 启动 vLLM 服务(BF16)====" vllm serve /model/snapshots/$(ls /model/snapshots/) \ --host 0.0.0.0 \ --port 8001 \ --tensor-parallel-size 8 \ --gpu-memory-utilization 0.92 \ --max-model-len 32768 \ --disable-custom-all-reduce \ --reasoning-parser qwen3 \ --enable-auto-tool-choice \ --tool-call-parser qwen3_coder \ --trust-remote-code ' ``` 如下图一直缓慢加载(预估一天时间):
全部评论(11)
只看楼主
A
aq
4楼
harbor.sourcefind.cn:5443/dcu/admin/base/custom:vllm018-ubuntu22.04-dtk26.04-gemma4-0413
该镜像可以正常部署gemma4、Qwen3.5-27B、minimax-2.7,只是没有做优化,速度较慢。实测4卡部署(部署的量化版),Qwen3.5-27B的每秒token为12.5,minimax-2.7的每秒token为19。昨天实测了工具、技能调用能力,相比vllm0.15,表现的很好了。推理能力也很稳定,未出现死循环、乱推理等情况。希望海光后期抓紧做好该镜像的优化适配,让用户早点用于实际工作!
4/15
K
kaiwong_mnt0vxc6icgq
回复 @aq
请教您一下,该镜像在4卡部署和8卡部署能带来成倍的提升吗?
4/15
A
aq
回复 @kaiwong_mnt0vxc6icgq
这个镜像没有做优化,速度还较慢,需要做了优化适配后,速度才会明显提升,按照以往海光的经验,优化适配后,速度至少翻倍
4/16
网
网友qmV8PF
3楼
启动正常,对话问答全是感叹号
4/15
_
_mnh7rl2mhlrm
回复 @网友qmV8PF
一样的问题,请问解决了吗,佬

4/21
Z
z1234567
2楼
麻烦看一下内核版本和系统版本吧
4/13
K
kaiwong_mnt0vxc6icgq
回复 @z1234567
操作系统版本:ubuntu22.04,
Linux user-NF5468H7 6.8.0-40-generic #40~22.04.3-Ubuntu SMP PREEMPT_DYNAMIC Tue Jul 30 17:30:19 UTC 2 x86_64 x86_64 x86_64 GNU/Linux

DCU驱动:版本: 6.3.30-V1.4.1
DTK版本: DTK-26.04-rc4

4/13
Z
z1234567
回复 @kaiwong_mnt0vxc6icgq
可以先在容器内切到/opt/dtk/bin目录下,执行 ./BandwidthTest -A,看下带宽是否正常,如果异常可尝试降低内核版本
4/14
K
kaiwong_mnt0vxc6icgq
回复 @z1234567
为了更快启动我换了Qwen3.5-35B-A3B模型,然后使用--enforce-eager 跳过编译,启动快了很多,没有看到了CUDA图异常缓慢的进度条了,能正常启动完成,但是发测试请求后出现问题了,不能正常返回推理,请看下面全部过程日志: 
[2026年 04月 14日 星期二 11:11:01 CST] Starting container and inference service
==========================================
0af21a2a55fb0fe089667ad2d90e09036ba4482eece70eaeb5913356931a47a5
/usr/local/lib/python3.10/dist-packages/torchvision/io/image.py:14: UserWarning: Failed to load image Python extension: 'Could not load this library: /usr/local/lib/python3.10/dist-packages/torchvision/image.so'If you don't plan on using image functionality from `torchvision.io`, you can ignore this warning. Otherwise, there might be something wrong with your environment. Did you have `libjpeg` or `libpng` installed before building `torchvision` from source?
  warn(
INFO: Please install lmslim if you want to infer the quantitative model of moe.

(APIServer pid=1) INFO 04-14 11:11:34 [utils.py:325] 
(APIServer pid=1) INFO 04-14 11:11:34 [utils.py:325] █ █ █▄ ▄█
(APIServer pid=1) INFO 04-14 11:11:34 [utils.py:325] ▄▄ ▄█ █ █ █ ▀▄▀ █ version 0.15.1
(APIServer pid=1) INFO 04-14 11:11:34 [utils.py:325] █▄█▀ █ █ █ █ model /mnt/ramdisk/Qwen3.5-35B-A3B
(APIServer pid=1) INFO 04-14 11:11:34 [utils.py:325] ▀▀ ▀▀▀▀▀ ▀▀▀▀▀ ▀ ▀
(APIServer pid=1) INFO 04-14 11:11:34 [utils.py:325] 
(APIServer pid=1) INFO 04-14 11:11:34 [utils.py:261] non-default args: {'model_tag': '/mnt/ramdisk/Qwen3.5-35B-A3B', 'api_server_count': 1, 'port': 8001, 'enable_auto_tool_choice': True, 'tool_call_parser': 'qwen3_coder', 'model': '/mnt/ramdisk/Qwen3.5-35B-A3B', 'enforce_eager': True, 'reasoning_parser': 'qwen3', 'tensor_parallel_size': 8}
(APIServer pid=1) Unrecognized keys in `rope_parameters` for 'rope_type'='default': {'mrope_section', 'mrope_interleaved'}
(APIServer pid=1) INFO 04-14 11:12:10 [model.py:548] Resolved architecture: Qwen3_5MoeForConditionalGeneration
(APIServer pid=1) INFO 04-14 11:12:10 [model.py:1573] Using max model len 262144
(APIServer pid=1) INFO 04-14 11:12:10 [scheduler.py:226] Chunked prefill is enabled with max_num_batched_tokens=10240.
(APIServer pid=1) INFO 04-14 11:12:10 [config.py:505] Setting attention block size to 192 tokens to ensure that attention page size is >= mamba page size.
(APIServer pid=1) INFO 04-14 11:12:10 [config.py:536] Padding mamba page size by 43.28% to ensure that mamba page size and attention page size are exactly equal.
(APIServer pid=1) INFO 04-14 11:12:10 [vllm.py:632] Asynchronous scheduling is enabled.
(APIServer pid=1) WARNING 04-14 11:12:10 [vllm.py:670] Enforce eager set, overriding optimization level to -O0
(APIServer pid=1) INFO 04-14 11:12:10 [vllm.py:773] Cudagraph is disabled under eager mode
/usr/local/lib/python3.10/dist-packages/torchvision/io/image.py:14: UserWarning: Failed to load image Python extension: 'Could not load this library: /usr/local/lib/python3.10/dist-packages/torchvision/image.so'If you don't plan on using image functionality from `torchvision.io`, you can ignore this warning. Otherwise, there might be something wrong with your environment. Did you have `libjpeg` or `libpng` installed before building `torchvision` from source?
  warn(
INFO: Please install lmslim if you want to infer the quantitative model of moe.

(EngineCore_DP0 pid=122) INFO 04-14 11:12:44 [core.py:96] Initializing a V1 LLM engine (v0.15.1) with config: model='/mnt/ramdisk/Qwen3.5-35B-A3B', speculative_config=None, tokenizer='/mnt/ramdisk/Qwen3.5-35B-A3B', skip_tokenizer_init=False, tokenizer_mode=auto, revision=None, tokenizer_revision=None, trust_remote_code=False, dtype=torch.bfloat16, max_seq_len=262144, download_dir=None, load_format=auto, tensor_parallel_size=8, pipeline_parallel_size=1, data_parallel_size=1, disable_custom_all_reduce=False, quantization=None, enforce_eager=True, enable_return_routed_experts=False, kv_cache_dtype=auto, device_config=cuda, structured_outputs_config=StructuredOutputsConfig(backend='auto', disable_fallback=False, disable_any_whitespace=False, disable_additional_properties=False, reasoning_parser='qwen3', reasoning_parser_plugin='', enable_in_reasoning=False), observability_config=ObservabilityConfig(show_hidden_metrics_for_version=None, otlp_traces_endpoint=None, collect_detailed_traces=None, kv_cache_metrics=False, kv_cache_metrics_sample=0.01, cudagraph_metrics=False, enable_layerwise_nvtx_tracing=False, enable_mfu_metrics=False, enable_mm_processor_stats=False, enable_logging_iteration_details=False), seed=0, served_model_name=/mnt/ramdisk/Qwen3.5-35B-A3B, enable_prefix_caching=False, enable_chunked_prefill=True, pooler_config=None, compilation_config={'level': None, 'mode': <CompilationMode.NONE: 0>, 'debug_dump_path': None, 'cache_dir': '', 'compile_cache_save_format': 'binary', 'backend': 'inductor', 'custom_ops': ['all', '+sparse_attn_indexer'], 'splitting_ops': [], 'compile_mm_encoder': False, 'compile_sizes': [], 'compile_ranges_split_points': [10240], 'inductor_compile_config': {'enable_auto_functionalized_v2': False, 'combo_kernels': True, 'benchmark_combo_kernel': True}, 'inductor_passes': {}, 'cudagraph_mode': <CUDAGraphMode.NONE: 0>, 'cudagraph_num_of_warmups': 0, 'cudagraph_capture_sizes': [], 'cudagraph_copy_inputs': False, 'cudagraph_specialize_lora': True, 'use_inductor_graph_partition': False, 'pass_config': {'fuse_norm_quant': False, 'fuse_act_quant': False, 'fuse_attn_quant': False, 'eliminate_noops': False, 'enable_sp': False, 'fuse_gemm_comms': False, 'fuse_allreduce_rms': False}, 'max_cudagraph_capture_size': 0, 'dynamic_shapes_config': {'type': <DynamicShapesType.BACKED: 'backed'>, 'evaluate_guards': False, 'assume_32_bit_indexing': True}, 'local_cache_dir': None, 'static_all_moe_layers': []}
/usr/local/lib/python3.10/dist-packages/torchvision/io/image.py:14: UserWarning: Failed to load image Python extension: 'Could not load this library: /usr/local/lib/python3.10/dist-packages/torchvision/image.so'If you don't plan on using image functionality from `torchvision.io`, you can ignore this warning. Otherwise, there might be something wrong with your environment. Did you have `libjpeg` or `libpng` installed before building `torchvision` from source?
  warn(
INFO: Please install lmslim if you want to infer the quantitative model of moe.

INFO 04-14 11:13:19 [parallel_state.py:1216] world_size=8 rank=7 local_rank=7 distributed_init_method=tcp://127.0.0.1:42431 backend=nccl
INFO: Please install lmslim if you want to infer the quantitative model of moe.

INFO 04-14 11:13:19 [parallel_state.py:1216] world_size=8 rank=3 local_rank=3 distributed_init_method=tcp://127.0.0.1:42431 backend=nccl
INFO: Please install lmslim if you want to infer the quantitative model of moe.

INFO 04-14 11:13:20 [parallel_state.py:1216] world_size=8 rank=4 local_rank=4 distributed_init_method=tcp://127.0.0.1:42431 backend=nccl
INFO: Please install lmslim if you want to infer the quantitative model of moe.

INFO 04-14 11:13:20 [parallel_state.py:1216] world_size=8 rank=5 local_rank=5 distributed_init_method=tcp://127.0.0.1:42431 backend=nccl
INFO: Please install lmslim if you want to infer the quantitative model of moe.

INFO 04-14 11:13:21 [parallel_state.py:1216] world_size=8 rank=1 local_rank=1 distributed_init_method=tcp://127.0.0.1:42431 backend=nccl
INFO: Please install lmslim if you want to infer the quantitative model of moe.

INFO 04-14 11:13:21 [parallel_state.py:1216] world_size=8 rank=2 local_rank=2 distributed_init_method=tcp://127.0.0.1:42431 backend=nccl
INFO: Please install lmslim if you want to infer the quantitative model of moe.

INFO 04-14 11:13:21 [parallel_state.py:1216] world_size=8 rank=0 local_rank=0 distributed_init_method=tcp://127.0.0.1:42431 backend=nccl
INFO: Please install lmslim if you want to infer the quantitative model of moe.

INFO 04-14 11:13:22 [parallel_state.py:1216] world_size=8 rank=6 local_rank=6 distributed_init_method=tcp://127.0.0.1:42431 backend=nccl
INFO 04-14 11:13:22 [pynccl.py:111] vLLM is using nccl==2.22.3
WARNING 04-14 11:13:32 [custom_all_reduce.py:172] We are using PCIe's custom allreduce.If the performance is poor, we can add --disable-custom-all-reduce in the instruction.
INFO 04-14 11:13:54 [parallel_state.py:1427] rank 0 in world size 8 is assigned as DP rank 0, PP rank 0, PCP rank 0, TP rank 0, EP rank 0
INFO 04-14 11:13:55 [parallel_state.py:1427] rank 1 in world size 8 is assigned as DP rank 0, PP rank 0, PCP rank 0, TP rank 1, EP rank 1
INFO 04-14 11:13:55 [parallel_state.py:1427] rank 2 in world size 8 is assigned as DP rank 0, PP rank 0, PCP rank 0, TP rank 2, EP rank 2
INFO 04-14 11:13:55 [parallel_state.py:1427] rank 3 in world size 8 is assigned as DP rank 0, PP rank 0, PCP rank 0, TP rank 3, EP rank 3
INFO 04-14 11:13:56 [parallel_state.py:1427] rank 4 in world size 8 is assigned as DP rank 0, PP rank 0, PCP rank 0, TP rank 4, EP rank 4
INFO 04-14 11:13:56 [parallel_state.py:1427] rank 5 in world size 8 is assigned as DP rank 0, PP rank 0, PCP rank 0, TP rank 5, EP rank 5
INFO 04-14 11:13:56 [parallel_state.py:1427] rank 6 in world size 8 is assigned as DP rank 0, PP rank 0, PCP rank 0, TP rank 6, EP rank 6
INFO 04-14 11:13:56 [parallel_state.py:1427] rank 7 in world size 8 is assigned as DP rank 0, PP rank 0, PCP rank 0, TP rank 7, EP rank 7
(Worker_TP4 pid=181) INFO 04-14 11:14:13 [rocm.py:450] Using Flash Attention backend for ViT model.
(Worker_TP4 pid=181) WARNING 04-14 11:14:13 [activation.py:680] [ROCm] PyTorch's native GELU with tanh approximation is unstable. Falling back to GELU(approximate='none').
(Worker_TP4 pid=181) INFO 04-14 11:14:13 [mm_encoder_attention.py:77] Using AttentionBackendEnum.FLASH_ATTN for MMEncoderAttention.
(Worker_TP0 pid=177) INFO 04-14 11:14:14 [gpu_model_runner.py:4167] Starting to load model /mnt/ramdisk/Qwen3.5-35B-A3B...
(Worker_TP7 pid=184) INFO 04-14 11:14:14 [rocm.py:450] Using Flash Attention backend for ViT model.
(Worker_TP7 pid=184) WARNING 04-14 11:14:14 [activation.py:680] [ROCm] PyTorch's native GELU with tanh approximation is unstable. Falling back to GELU(approximate='none').
(Worker_TP7 pid=184) INFO 04-14 11:14:14 [mm_encoder_attention.py:77] Using AttentionBackendEnum.FLASH_ATTN for MMEncoderAttention.
(Worker_TP4 pid=181) INFO 04-14 11:14:14 [rocm.py:328] Using Flash Attention backend with unified varlen kernel on V1 engine. (block size 192, requires block size divisible by 64)
(Worker_TP5 pid=182) INFO 04-14 11:14:15 [rocm.py:450] Using Flash Attention backend for ViT model.
(Worker_TP5 pid=182) WARNING 04-14 11:14:15 [activation.py:680] [ROCm] PyTorch's native GELU with tanh approximation is unstable. Falling back to GELU(approximate='none').
(Worker_TP5 pid=182) INFO 04-14 11:14:15 [mm_encoder_attention.py:77] Using AttentionBackendEnum.FLASH_ATTN for MMEncoderAttention.
(Worker_TP7 pid=184) INFO 04-14 11:14:16 [rocm.py:328] Using Flash Attention backend with unified varlen kernel on V1 engine. (block size 192, requires block size divisible by 64)
(Worker_TP5 pid=182) INFO 04-14 11:14:17 [rocm.py:328] Using Flash Attention backend with unified varlen kernel on V1 engine. (block size 192, requires block size divisible by 64)
(Worker_TP6 pid=183) INFO 04-14 11:14:17 [rocm.py:450] Using Flash Attention backend for ViT model.
(Worker_TP6 pid=183) WARNING 04-14 11:14:17 [activation.py:680] [ROCm] PyTorch's native GELU with tanh approximation is unstable. Falling back to GELU(approximate='none').
(Worker_TP6 pid=183) INFO 04-14 11:14:17 [mm_encoder_attention.py:77] Using AttentionBackendEnum.FLASH_ATTN for MMEncoderAttention.
(Worker_TP2 pid=179) INFO 04-14 11:14:17 [rocm.py:450] Using Flash Attention backend for ViT model.
(Worker_TP2 pid=179) WARNING 04-14 11:14:17 [activation.py:680] [ROCm] PyTorch's native GELU with tanh approximation is unstable. Falling back to GELU(approximate='none').
(Worker_TP2 pid=179) INFO 04-14 11:14:17 [mm_encoder_attention.py:77] Using AttentionBackendEnum.FLASH_ATTN for MMEncoderAttention.
(Worker_TP4 pid=181) WARNING 04-14 11:14:17 [compilation.py:1080] Op 'sparse_attn_indexer' not present in model, enabling with '+sparse_attn_indexer' has no effect
(Worker_TP0 pid=177) INFO 04-14 11:14:18 [rocm.py:450] Using Flash Attention backend for ViT model.
(Worker_TP0 pid=177) WARNING 04-14 11:14:18 [activation.py:680] [ROCm] PyTorch's native GELU with tanh approximation is unstable. Falling back to GELU(approximate='none').
(Worker_TP0 pid=177) INFO 04-14 11:14:18 [mm_encoder_attention.py:77] Using AttentionBackendEnum.FLASH_ATTN for MMEncoderAttention.
(Worker_TP1 pid=178) INFO 04-14 11:14:18 [rocm.py:450] Using Flash Attention backend for ViT model.
(Worker_TP1 pid=178) WARNING 04-14 11:14:18 [activation.py:680] [ROCm] PyTorch's native GELU with tanh approximation is unstable. Falling back to GELU(approximate='none').
(Worker_TP1 pid=178) INFO 04-14 11:14:18 [mm_encoder_attention.py:77] Using AttentionBackendEnum.FLASH_ATTN for MMEncoderAttention.
(Worker_TP6 pid=183) INFO 04-14 11:14:18 [rocm.py:328] Using Flash Attention backend with unified varlen kernel on V1 engine. (block size 192, requires block size divisible by 64)
(Worker_TP2 pid=179) INFO 04-14 11:14:18 [rocm.py:328] Using Flash Attention backend with unified varlen kernel on V1 engine. (block size 192, requires block size divisible by 64)
(Worker_TP0 pid=177) INFO 04-14 11:14:19 [unquantized.py:103] Using TRITON backend for Unquantized MoE
(Worker_TP0 pid=177) INFO 04-14 11:14:19 [rocm.py:328] Using Flash Attention backend with unified varlen kernel on V1 engine. (block size 192, requires block size divisible by 64)
(Worker_TP7 pid=184) WARNING 04-14 11:14:19 [compilation.py:1080] Op 'sparse_attn_indexer' not present in model, enabling with '+sparse_attn_indexer' has no effect
(Worker_TP1 pid=178) INFO 04-14 11:14:19 [rocm.py:328] Using Flash Attention backend with unified varlen kernel on V1 engine. (block size 192, requires block size divisible by 64)
(Worker_TP3 pid=180) INFO 04-14 11:14:21 [rocm.py:450] Using Flash Attention backend for ViT model.
(Worker_TP3 pid=180) WARNING 04-14 11:14:21 [activation.py:680] [ROCm] PyTorch's native GELU with tanh approximation is unstable. Falling back to GELU(approximate='none').
(Worker_TP3 pid=180) INFO 04-14 11:14:21 [mm_encoder_attention.py:77] Using AttentionBackendEnum.FLASH_ATTN for MMEncoderAttention.
(Worker_TP5 pid=182) WARNING 04-14 11:14:21 [compilation.py:1080] Op 'sparse_attn_indexer' not present in model, enabling with '+sparse_attn_indexer' has no effect
(Worker_TP6 pid=183) WARNING 04-14 11:14:21 [compilation.py:1080] Op 'sparse_attn_indexer' not present in model, enabling with '+sparse_attn_indexer' has no effect
(Worker_TP3 pid=180) INFO 04-14 11:14:22 [rocm.py:328] Using Flash Attention backend with unified varlen kernel on V1 engine. (block size 192, requires block size divisible by 64)
(Worker_TP2 pid=179) WARNING 04-14 11:14:22 [compilation.py:1080] Op 'sparse_attn_indexer' not present in model, enabling with '+sparse_attn_indexer' has no effect
(Worker_TP0 pid=177) WARNING 04-14 11:14:23 [compilation.py:1080] Op 'sparse_attn_indexer' not present in model, enabling with '+sparse_attn_indexer' has no effect
Loading safetensors checkpoint shards: 0% Completed | 0/14 [00:00<?, ?it/s]
(Worker_TP1 pid=178) WARNING 04-14 11:14:23 [compilation.py:1080] Op 'sparse_attn_indexer' not present in model, enabling with '+sparse_attn_indexer' has no effect
(Worker_TP3 pid=180) WARNING 04-14 11:14:25 [compilation.py:1080] Op 'sparse_attn_indexer' not present in model, enabling with '+sparse_attn_indexer' has no effect
Loading safetensors checkpoint shards: 7% Completed | 1/14 [00:20<04:26, 20.50s/it]
Loading safetensors checkpoint shards: 14% Completed | 2/14 [00:41<04:08, 20.68s/it]
Loading safetensors checkpoint shards: 21% Completed | 3/14 [01:01<03:45, 20.52s/it]
Loading safetensors checkpoint shards: 29% Completed | 4/14 [01:21<03:23, 20.32s/it]
Loading safetensors checkpoint shards: 36% Completed | 5/14 [01:41<03:02, 20.23s/it]
Loading safetensors checkpoint shards: 43% Completed | 6/14 [02:02<02:42, 20.34s/it]
Loading safetensors checkpoint shards: 50% Completed | 7/14 [02:22<02:21, 20.25s/it]
Loading safetensors checkpoint shards: 57% Completed | 8/14 [02:42<02:00, 20.14s/it]
Loading safetensors checkpoint shards: 64% Completed | 9/14 [03:03<01:42, 20.46s/it]
Loading safetensors checkpoint shards: 71% Completed | 10/14 [03:39<01:40, 25.15s/it]
Loading safetensors checkpoint shards: 79% Completed | 11/14 [04:14<01:24, 28.14s/it]
Loading safetensors checkpoint shards: 86% Completed | 12/14 [04:45<00:58, 29.32s/it]
Loading safetensors checkpoint shards: 93% Completed | 13/14 [05:12<00:28, 28.61s/it]
Loading safetensors checkpoint shards: 100% Completed | 14/14 [05:20<00:00, 22.18s/it]
Loading safetensors checkpoint shards: 100% Completed | 14/14 [05:20<00:00, 22.88s/it]
(Worker_TP0 pid=177) 
(Worker_TP0 pid=177) INFO 04-14 11:19:43 [default_loader.py:291] Loading weights took 320.36 seconds
(Worker_TP0 pid=177) INFO 04-14 11:19:44 [gpu_model_runner.py:4264] Model loading took 8.36 GiB memory and 327.784347 seconds
(Worker_TP3 pid=180) INFO 04-14 11:21:05 [gpu_model_runner.py:5103] Encoder cache will be initialized with a budget of 16384 tokens, and profiled with 1 image items of the maximum feature size.
(Worker_TP5 pid=182) INFO 04-14 11:21:05 [gpu_model_runner.py:5103] Encoder cache will be initialized with a budget of 16384 tokens, and profiled with 1 image items of the maximum feature size.
(Worker_TP0 pid=177) INFO 04-14 11:21:05 [gpu_model_runner.py:5103] Encoder cache will be initialized with a budget of 16384 tokens, and profiled with 1 image items of the maximum feature size.
(Worker_TP6 pid=183) INFO 04-14 11:21:05 [gpu_model_runner.py:5103] Encoder cache will be initialized with a budget of 16384 tokens, and profiled with 1 image items of the maximum feature size.
(Worker_TP2 pid=179) INFO 04-14 11:21:05 [gpu_model_runner.py:5103] Encoder cache will be initialized with a budget of 16384 tokens, and profiled with 1 image items of the maximum feature size.
(Worker_TP7 pid=184) INFO 04-14 11:21:05 [gpu_model_runner.py:5103] Encoder cache will be initialized with a budget of 16384 tokens, and profiled with 1 image items of the maximum feature size.
(Worker_TP4 pid=181) INFO 04-14 11:21:05 [gpu_model_runner.py:5103] Encoder cache will be initialized with a budget of 16384 tokens, and profiled with 1 image items of the maximum feature size.
(Worker_TP1 pid=178) INFO 04-14 11:21:05 [gpu_model_runner.py:5103] Encoder cache will be initialized with a budget of 16384 tokens, and profiled with 1 image items of the maximum feature size.
(EngineCore_DP0 pid=122) INFO 04-14 11:22:04 [shm_broadcast.py:542] No available shared memory broadcast block found in 60 seconds. This typically happens when some processes are hanging or doing some time-consuming work (e.g. compilation, weight/kv cache quantization).
(EngineCore_DP0 pid=122) INFO 04-14 11:23:04 [shm_broadcast.py:542] No available shared memory broadcast block found in 60 seconds. This typically happens when some processes are hanging or doing some time-consuming work (e.g. compilation, weight/kv cache quantization).
(EngineCore_DP0 pid=122) INFO 04-14 11:24:04 [shm_broadcast.py:542] No available shared memory broadcast block found in 60 seconds. This typically happens when some processes are hanging or doing some time-consuming work (e.g. compilation, weight/kv cache quantization).
(EngineCore_DP0 pid=122) INFO 04-14 11:25:04 [shm_broadcast.py:542] No available shared memory broadcast block found in 60 seconds. This typically happens when some processes are hanging or doing some time-consuming work (e.g. compilation, weight/kv cache quantization).
(EngineCore_DP0 pid=122) INFO 04-14 11:26:04 [shm_broadcast.py:542] No available shared memory broadcast block found in 60 seconds. This typically happens when some processes are hanging or doing some time-consuming work (e.g. compilation, weight/kv cache quantization).
(EngineCore_DP0 pid=122) INFO 04-14 11:27:04 [shm_broadcast.py:542] No available shared memory broadcast block found in 60 seconds. This typically happens when some processes are hanging or doing some time-consuming work (e.g. compilation, weight/kv cache quantization).
(EngineCore_DP0 pid=122) INFO 04-14 11:28:04 [shm_broadcast.py:542] No available shared memory broadcast block found in 60 seconds. This typically happens when some processes are hanging or doing some time-consuming work (e.g. compilation, weight/kv cache quantization).
(EngineCore_DP0 pid=122) INFO 04-14 11:29:04 [shm_broadcast.py:542] No available shared memory broadcast block found in 60 seconds. This typically happens when some processes are hanging or doing some time-consuming work (e.g. compilation, weight/kv cache quantization).
(EngineCore_DP0 pid=122) INFO 04-14 11:30:04 [shm_broadcast.py:542] No available shared memory broadcast block found in 60 seconds. This typically happens when some processes are hanging or doing some time-consuming work (e.g. compilation, weight/kv cache quantization).
(EngineCore_DP0 pid=122) INFO 04-14 11:31:04 [shm_broadcast.py:542] No available shared memory broadcast block found in 60 seconds. This typically happens when some processes are hanging or doing some time-consuming work (e.g. compilation, weight/kv cache quantization).
(Worker_TP0 pid=177) INFO 04-14 11:31:37 [fused_moe.py:1129] Using configuration from /usr/local/lib/python3.10/dist-packages/vllm/model_executor/layers/fused_moe/configs/E=256,N=64,device_name=gfx928_120cu_nn.json for MoE layer.
(EngineCore_DP0 pid=122) INFO 04-14 11:32:04 [shm_broadcast.py:542] No available shared memory broadcast block found in 60 seconds. This typically happens when some processes are hanging or doing some time-consuming work (e.g. compilation, weight/kv cache quantization).
(EngineCore_DP0 pid=122) INFO 04-14 11:33:04 [shm_broadcast.py:542] No available shared memory broadcast block found in 60 seconds. This typically happens when some processes are hanging or doing some time-consuming work (e.g. compilation, weight/kv cache quantization).
(EngineCore_DP0 pid=122) INFO 04-14 11:34:04 [shm_broadcast.py:542] No available shared memory broadcast block found in 60 seconds. This typically happens when some processes are hanging or doing some time-consuming work (e.g. compilation, weight/kv cache quantization).
(EngineCore_DP0 pid=122) INFO 04-14 11:35:04 [shm_broadcast.py:542] No available shared memory broadcast block found in 60 seconds. This typically happens when some processes are hanging or doing some time-consuming work (e.g. compilation, weight/kv cache quantization).
(EngineCore_DP0 pid=122) INFO 04-14 11:36:04 [shm_broadcast.py:542] No available shared memory broadcast block found in 60 seconds. This typically happens when some processes are hanging or doing some time-consuming work (e.g. compilation, weight/kv cache quantization).
(EngineCore_DP0 pid=122) INFO 04-14 11:37:04 [shm_broadcast.py:542] No available shared memory broadcast block found in 60 seconds. This typically happens when some processes are hanging or doing some time-consuming work (e.g. compilation, weight/kv cache quantization).
(Worker_TP0 pid=177) INFO 04-14 11:37:54 [gpu_worker.py:356] Available KV cache memory: 45.07 GiB
(EngineCore_DP0 pid=122) INFO 04-14 11:37:57 [kv_cache_utils.py:1307] GPU KV cache size: 1,180,992 tokens
(EngineCore_DP0 pid=122) INFO 04-14 11:37:57 [kv_cache_utils.py:1312] Maximum concurrency for 262,144 tokens per request: 17.97x
(EngineCore_DP0 pid=122) INFO 04-14 11:39:03 [shm_broadcast.py:542] No available shared memory broadcast block found in 60 seconds. This typically happens when some processes are hanging or doing some time-consuming work (e.g. compilation, weight/kv cache quantization).
(EngineCore_DP0 pid=122) INFO 04-14 11:40:03 [shm_broadcast.py:542] No available shared memory broadcast block found in 60 seconds. This typically happens when some processes are hanging or doing some time-consuming work (e.g. compilation, weight/kv cache quantization).
(EngineCore_DP0 pid=122) INFO 04-14 11:41:03 [shm_broadcast.py:542] No available shared memory broadcast block found in 60 seconds. This typically happens when some processes are hanging or doing some time-consuming work (e.g. compilation, weight/kv cache quantization).
(EngineCore_DP0 pid=122) INFO 04-14 11:42:03 [shm_broadcast.py:542] No available shared memory broadcast block found in 60 seconds. This typically happens when some processes are hanging or doing some time-consuming work (e.g. compilation, weight/kv cache quantization).
(EngineCore_DP0 pid=122) INFO 04-14 11:43:03 [shm_broadcast.py:542] No available shared memory broadcast block found in 60 seconds. This typically happens when some processes are hanging or doing some time-consuming work (e.g. compilation, weight/kv cache quantization).
(EngineCore_DP0 pid=122) INFO 04-14 11:44:03 [shm_broadcast.py:542] No available shared memory broadcast block found in 60 seconds. This typically happens when some processes are hanging or doing some time-consuming work (e.g. compilation, weight/kv cache quantization).
(EngineCore_DP0 pid=122) INFO 04-14 11:45:02 [core.py:272] init engine (profile, create kv cache, warmup model) took 1438.24 seconds
(EngineCore_DP0 pid=122) INFO 04-14 11:45:19 [vllm.py:632] Asynchronous scheduling is enabled.
(EngineCore_DP0 pid=122) WARNING 04-14 11:45:19 [vllm.py:677] Inductor compilation was disabled by user settings, optimizations settings that are only active during inductor compilation will be ignored.
(EngineCore_DP0 pid=122) INFO 04-14 11:45:19 [vllm.py:773] Cudagraph is disabled under eager mode
(APIServer pid=1) INFO 04-14 11:45:19 [api_server.py:665] Supported tasks: ['generate']
(APIServer pid=1) WARNING 04-14 11:45:19 [model.py:1383] Default vLLM sampling parameters have been overridden by the model's `generation_config.json`: `{'temperature': 1.0, 'top_k': 20, 'top_p': 0.95}`. If this is not intended, please relaunch vLLM instance with `--generation-config vllm`.
(APIServer pid=1) INFO 04-14 11:45:19 [serving.py:273] "auto" tool choice has been enabled.
(APIServer pid=1) INFO 04-14 11:45:19 [serving.py:177] Warming up chat template processing...
(APIServer pid=1) INFO 04-14 11:45:23 [hf.py:311] Detected the chat template content format to be 'string'. You can set `--chat-template-content-format` to override this.
(APIServer pid=1) INFO 04-14 11:45:23 [serving.py:212] Chat template warmup completed in 3539.0ms
(APIServer pid=1) INFO 04-14 11:45:23 [serving.py:273] "auto" tool choice has been enabled.
(APIServer pid=1) INFO 04-14 11:45:23 [api_server.py:946] Starting vLLM API server 0 on http://0.0.0.0:8001
(APIServer pid=1) INFO 04-14 11:45:23 [launcher.py:38] Available routes are:
(APIServer pid=1) INFO 04-14 11:45:23 [launcher.py:46] Route: /openapi.json, Methods: HEAD, GET
(APIServer pid=1) INFO 04-14 11:45:23 [launcher.py:46] Route: /docs, Methods: HEAD, GET
(APIServer pid=1) INFO 04-14 11:45:23 [launcher.py:46] Route: /docs/oauth2-redirect, Methods: HEAD, GET
(APIServer pid=1) INFO 04-14 11:45:23 [launcher.py:46] Route: /redoc, Methods: HEAD, GET
(APIServer pid=1) INFO 04-14 11:45:23 [launcher.py:46] Route: /scale_elastic_ep, Methods: POST
(APIServer pid=1) INFO 04-14 11:45:23 [launcher.py:46] Route: /is_scaling_elastic_ep, Methods: POST
(APIServer pid=1) INFO 04-14 11:45:23 [launcher.py:46] Route: /tokenize, Methods: POST
(APIServer pid=1) INFO 04-14 11:45:23 [launcher.py:46] Route: /detokenize, Methods: POST
(APIServer pid=1) INFO 04-14 11:45:23 [launcher.py:46] Route: /inference/v1/generate, Methods: POST
(APIServer pid=1) INFO 04-14 11:45:23 [launcher.py:46] Route: /pause, Methods: POST
(APIServer pid=1) INFO 04-14 11:45:23 [launcher.py:46] Route: /resume, Methods: POST
(APIServer pid=1) INFO 04-14 11:45:23 [launcher.py:46] Route: /is_paused, Methods: GET
(APIServer pid=1) INFO 04-14 11:45:23 [launcher.py:46] Route: /metrics, Methods: GET
(APIServer pid=1) INFO 04-14 11:45:23 [launcher.py:46] Route: /health, Methods: GET
(APIServer pid=1) INFO 04-14 11:45:23 [launcher.py:46] Route: /v1/chat/completions, Methods: POST
(APIServer pid=1) INFO 04-14 11:45:23 [launcher.py:46] Route: /v1/chat/completions/render, Methods: POST
(APIServer pid=1) INFO 04-14 11:45:23 [launcher.py:46] Route: /v1/responses, Methods: POST
(APIServer pid=1) INFO 04-14 11:45:23 [launcher.py:46] Route: /v1/responses/{response_id}, Methods: GET
(APIServer pid=1) INFO 04-14 11:45:23 [launcher.py:46] Route: /v1/responses/{response_id}/cancel, Methods: POST
(APIServer pid=1) INFO 04-14 11:45:23 [launcher.py:46] Route: /v1/audio/transcriptions, Methods: POST
(APIServer pid=1) INFO 04-14 11:45:23 [launcher.py:46] Route: /v1/audio/translations, Methods: POST
(APIServer pid=1) INFO 04-14 11:45:23 [launcher.py:46] Route: /v1/completions, Methods: POST
(APIServer pid=1) INFO 04-14 11:45:23 [launcher.py:46] Route: /v1/completions/render, Methods: POST
(APIServer pid=1) INFO 04-14 11:45:23 [launcher.py:46] Route: /v1/messages, Methods: POST
(APIServer pid=1) INFO 04-14 11:45:23 [launcher.py:46] Route: /v1/models, Methods: GET
(APIServer pid=1) INFO 04-14 11:45:23 [launcher.py:46] Route: /load, Methods: GET
(APIServer pid=1) INFO 04-14 11:45:23 [launcher.py:46] Route: /version, Methods: GET
(APIServer pid=1) INFO 04-14 11:45:23 [launcher.py:46] Route: /ping, Methods: GET
(APIServer pid=1) INFO 04-14 11:45:23 [launcher.py:46] Route: /ping, Methods: POST
(APIServer pid=1) INFO 04-14 11:45:23 [launcher.py:46] Route: /invocations, Methods: POST
(APIServer pid=1) INFO 04-14 11:45:23 [launcher.py:46] Route: /classify, Methods: POST
(APIServer pid=1) INFO 04-14 11:45:23 [launcher.py:46] Route: /v1/embeddings, Methods: POST
(APIServer pid=1) INFO 04-14 11:45:23 [launcher.py:46] Route: /score, Methods: POST
(APIServer pid=1) INFO 04-14 11:45:23 [launcher.py:46] Route: /v1/score, Methods: POST
(APIServer pid=1) INFO 04-14 11:45:23 [launcher.py:46] Route: /rerank, Methods: POST
(APIServer pid=1) INFO 04-14 11:45:23 [launcher.py:46] Route: /v1/rerank, Methods: POST
(APIServer pid=1) INFO 04-14 11:45:23 [launcher.py:46] Route: /v2/rerank, Methods: POST
(APIServer pid=1) INFO 04-14 11:45:23 [launcher.py:46] Route: /pooling, Methods: POST
(APIServer pid=1) INFO: Started server process [1]
(APIServer pid=1) INFO: Waiting for application startup.
(APIServer pid=1) INFO: Application startup complete.
(APIServer pid=1) INFO: 127.0.0.1:40344 - "GET /v1/models HTTP/1.1" 200 OK
(APIServer pid=1) WARNING 04-14 11:52:06 [input_processor.py:479] VLLM_DISABLE_REQUEST_ID_RANDOMIZATION is set and will be removed in a future release. Duplicate externally-provided request IDs may cause failures and/or subtle correctness errors.
(EngineCore_DP0 pid=122) INFO 04-14 11:53:06 [shm_broadcast.py:542] No available shared memory broadcast block found in 60 seconds. This typically happens when some processes are hanging or doing some time-consuming work (e.g. compilation, weight/kv cache quantization).
(EngineCore_DP0 pid=122) INFO 04-14 11:54:06 [shm_broadcast.py:542] No available shared memory broadcast block found in 60 seconds. This typically happens when some processes are hanging or doing some time-consuming work (e.g. compilation, weight/kv cache quantization).
(EngineCore_DP0 pid=122) INFO 04-14 11:55:06 [shm_broadcast.py:542] No available shared memory broadcast block found in 60 seconds. This typically happens when some processes are hanging or doing some time-consuming work (e.g. compilation, weight/kv cache quantization).
(EngineCore_DP0 pid=122) INFO 04-14 11:56:06 [shm_broadcast.py:542] No available shared memory broadcast block found in 60 seconds. This typically happens when some processes are hanging or doing some time-consuming work (e.g. compilation, weight/kv cache quantization).
(EngineCore_DP0 pid=122) ERROR 04-14 11:57:06 [dump_input.py:72] Dumping input data for V1 LLM engine (v0.15.1) with config: model='/mnt/ramdisk/Qwen3.5-35B-A3B', speculative_config=None, tokenizer='/mnt/ramdisk/Qwen3.5-35B-A3B', skip_tokenizer_init=False, tokenizer_mode=auto, revision=None, tokenizer_revision=None, trust_remote_code=False, dtype=torch.bfloat16, max_seq_len=262144, download_dir=None, load_format=auto, tensor_parallel_size=8, pipeline_parallel_size=1, data_parallel_size=1, disable_custom_all_reduce=False, quantization=None, enforce_eager=True, enable_return_routed_experts=False, kv_cache_dtype=auto, device_config=cuda, structured_outputs_config=StructuredOutputsConfig(backend='auto', disable_fallback=False, disable_any_whitespace=False, disable_additional_properties=False, reasoning_parser='qwen3', reasoning_parser_plugin='', enable_in_reasoning=False), observability_config=ObservabilityConfig(show_hidden_metrics_for_version=None, otlp_traces_endpoint=None, collect_detailed_traces=None, kv_cache_metrics=False, kv_cache_metrics_sample=0.01, cudagraph_metrics=False, enable_layerwise_nvtx_tracing=False, enable_mfu_metrics=False, enable_mm_processor_stats=False, enable_logging_iteration_details=False), seed=0, served_model_name=/mnt/ramdisk/Qwen3.5-35B-A3B, enable_prefix_caching=False, enable_chunked_prefill=True, pooler_config=None, compilation_config={'level': None, 'mode': <CompilationMode.NONE: 0>, 'debug_dump_path': None, 'cache_dir': '', 'compile_cache_save_format': 'binary', 'backend': 'inductor', 'custom_ops': ['all', '+sparse_attn_indexer', '+sparse_attn_indexer'], 'splitting_ops': [], 'compile_mm_encoder': False, 'compile_sizes': [], 'compile_ranges_split_points': [10240], 'inductor_compile_config': {'enable_auto_functionalized_v2': False, 'combo_kernels': True, 'benchmark_combo_kernel': True}, 'inductor_passes': {}, 'cudagraph_mode': <CUDAGraphMode.NONE: 0>, 'cudagraph_num_of_warmups': 0, 'cudagraph_capture_sizes': [], 'cudagraph_copy_inputs': False, 'cudagraph_specialize_lora': True, 'use_inductor_graph_partition': False, 'pass_config': {'fuse_norm_quant': False, 'fuse_act_quant': False, 'fuse_attn_quant': False, 'eliminate_noops': False, 'enable_sp': False, 'fuse_gemm_comms': False, 'fuse_allreduce_rms': False}, 'max_cudagraph_capture_size': 0, 'dynamic_shapes_config': {'type': <DynamicShapesType.BACKED: 'backed'>, 'evaluate_guards': False, 'assume_32_bit_indexing': True}, 'local_cache_dir': None, 'static_all_moe_layers': []}, 
(EngineCore_DP0 pid=122) ERROR 04-14 11:57:06 [dump_input.py:79] Dumping scheduler output for model execution: SchedulerOutput(scheduled_new_reqs=[NewRequestData(req_id=chatcmpl-bfd60e73be82a50f,prompt_token_ids_len=21,prefill_token_ids_len=None,mm_features=[],sampling_params=SamplingParams(n=1, presence_penalty=0.0, frequency_penalty=0.0, repetition_penalty=1.0, temperature=0.6, top_p=0.95, top_k=20, min_p=0.0, seed=None, stop=[], stop_token_ids=[248044], bad_words=[], include_stop_str_in_output=False, ignore_eos=False, max_tokens=512, min_tokens=0, logprobs=None, prompt_logprobs=None, skip_special_tokens=True, spaces_between_special_tokens=True, truncate_prompt_tokens=None, structured_outputs=None, extra_args=None),block_ids=([1], [2], [3], [4]),num_computed_tokens=0,lora_request=None,prompt_embeds_shape=None)], scheduled_cached_reqs=CachedRequestData(req_ids=[],resumed_req_ids=set(),new_token_ids_lens=[],all_token_ids_lens={},new_block_ids=[],num_computed_tokens=[],num_output_tokens=[]), num_scheduled_tokens={chatcmpl-bfd60e73be82a50f: 21}, total_num_scheduled_tokens=21, scheduled_spec_decode_tokens={}, scheduled_encoder_inputs={}, num_common_prefix_blocks=[0, 0, 0, 0], finished_req_ids=[], free_encoder_mm_hashes=[], preempted_req_ids=[], has_structured_output_requests=false, pending_structured_output_tokens=false, num_invalid_spec_tokens=null, kv_connector_metadata=null, ec_connector_metadata=null)
(EngineCore_DP0 pid=122) ERROR 04-14 11:57:06 [dump_input.py:81] Dumping scheduler stats: SchedulerStats(num_running_reqs=1, num_waiting_reqs=0, step_counter=0, current_wave=0, kv_cache_usage=0.00016256197675368345, prefix_cache_stats=PrefixCacheStats(reset=False, requests=0, queries=0, hits=0, preempted_requests=0, preempted_queries=0, preempted_hits=0), connector_prefix_cache_stats=None, kv_cache_eviction_events=[], spec_decoding_stats=None, kv_connector_stats=None, waiting_lora_adapters={}, running_lora_adapters={}, cudagraph_stats=None, perf_stats=None)
(EngineCore_DP0 pid=122) ERROR 04-14 11:57:06 [core.py:948] EngineCore encountered a fatal error.
(EngineCore_DP0 pid=122) ERROR 04-14 11:57:06 [core.py:948] Traceback (most recent call last):
(EngineCore_DP0 pid=122) ERROR 04-14 11:57:06 [core.py:948] File "/usr/local/lib/python3.10/dist-packages/vllm/v1/executor/multiproc_executor.py", line 351, in get_response
(EngineCore_DP0 pid=122) ERROR 04-14 11:57:06 [core.py:948] status, result = mq.dequeue(
(EngineCore_DP0 pid=122) ERROR 04-14 11:57:06 [core.py:948] File "/usr/local/lib/python3.10/dist-packages/vllm/distributed/device_communicators/shm_broadcast.py", line 616, in dequeue
(EngineCore_DP0 pid=122) ERROR 04-14 11:57:06 [core.py:948] with self.acquire_read(timeout, cancel, indefinite) as buf:
(EngineCore_DP0 pid=122) ERROR 04-14 11:57:06 [core.py:948] File "/usr/lib/python3.10/contextlib.py", line 135, in __enter__
(EngineCore_DP0 pid=122) ERROR 04-14 11:57:06 [core.py:948] return next(self.gen)
(EngineCore_DP0 pid=122) ERROR 04-14 11:57:06 [core.py:948] File "/usr/local/lib/python3.10/dist-packages/vllm/distributed/device_communicators/shm_broadcast.py", line 536, in acquire_read
(EngineCore_DP0 pid=122) ERROR 04-14 11:57:06 [core.py:948] raise TimeoutError
(EngineCore_DP0 pid=122) ERROR 04-14 11:57:06 [core.py:948] TimeoutError
(EngineCore_DP0 pid=122) ERROR 04-14 11:57:06 [core.py:948] 
(EngineCore_DP0 pid=122) ERROR 04-14 11:57:06 [core.py:948] The above exception was the direct cause of the following exception:
(EngineCore_DP0 pid=122) ERROR 04-14 11:57:06 [core.py:948] 
(EngineCore_DP0 pid=122) ERROR 04-14 11:57:06 [core.py:948] Traceback (most recent call last):
(EngineCore_DP0 pid=122) ERROR 04-14 11:57:06 [core.py:948] File "/usr/local/lib/python3.10/dist-packages/vllm/v1/engine/core.py", line 939, in run_engine_core
(EngineCore_DP0 pid=122) ERROR 04-14 11:57:06 [core.py:948] engine_core.run_busy_loop()
(EngineCore_DP0 pid=122) ERROR 04-14 11:57:06 [core.py:948] File "/usr/local/lib/python3.10/dist-packages/vllm/v1/engine/core.py", line 966, in run_busy_loop
(EngineCore_DP0 pid=122) ERROR 04-14 11:57:06 [core.py:948] self._process_engine_step()
(EngineCore_DP0 pid=122) ERROR 04-14 11:57:06 [core.py:948] File "/usr/local/lib/python3.10/dist-packages/vllm/v1/engine/core.py", line 999, in _process_engine_step
(EngineCore_DP0 pid=122) ERROR 04-14 11:57:06 [core.py:948] outputs, model_executed = self.step_fn()
(EngineCore_DP0 pid=122) ERROR 04-14 11:57:06 [core.py:948] File "/usr/local/lib/python3.10/dist-packages/vllm/v1/engine/core.py", line 486, in step_with_batch_queue
(EngineCore_DP0 pid=122) ERROR 04-14 11:57:06 [core.py:948] model_output = future.result()
(EngineCore_DP0 pid=122) ERROR 04-14 11:57:06 [core.py:948] File "/usr/local/lib/python3.10/dist-packages/vllm/v1/executor/multiproc_executor.py", line 80, in result
(EngineCore_DP0 pid=122) ERROR 04-14 11:57:06 [core.py:948] return super().result()
(EngineCore_DP0 pid=122) ERROR 04-14 11:57:06 [core.py:948] File "/usr/lib/python3.10/concurrent/futures/_base.py", line 451, in result
(EngineCore_DP0 pid=122) ERROR 04-14 11:57:06 [core.py:948] return self.__get_result()
(EngineCore_DP0 pid=122) ERROR 04-14 11:57:06 [core.py:948] File "/usr/lib/python3.10/concurrent/futures/_base.py", line 403, in __get_result
(EngineCore_DP0 pid=122) ERROR 04-14 11:57:06 [core.py:948] raise self._exception
(EngineCore_DP0 pid=122) ERROR 04-14 11:57:06 [core.py:948] File "/usr/local/lib/python3.10/dist-packages/vllm/v1/executor/multiproc_executor.py", line 84, in wait_for_response
(EngineCore_DP0 pid=122) ERROR 04-14 11:57:06 [core.py:948] response = self.aggregate(get_response())
(EngineCore_DP0 pid=122) ERROR 04-14 11:57:06 [core.py:948] File "/usr/local/lib/python3.10/dist-packages/vllm/v1/executor/multiproc_executor.py", line 355, in get_response
(EngineCore_DP0 pid=122) ERROR 04-14 11:57:06 [core.py:948] raise TimeoutError(f"RPC call to {method} timed out.") from e
(EngineCore_DP0 pid=122) ERROR 04-14 11:57:06 [core.py:948] TimeoutError: RPC call to sample_tokens timed out.
(Worker_TP7 pid=184) INFO 04-14 11:57:06 [multiproc_executor.py:730] Parent process exited, terminating worker
(Worker_TP0 pid=177) INFO 04-14 11:57:06 [multiproc_executor.py:730] Parent process exited, terminating worker
(Worker_TP2 pid=179) INFO 04-14 11:57:06 [multiproc_executor.py:730] Parent process exited, terminating worker
(APIServer pid=1) ERROR 04-14 11:57:06 [async_llm.py:693] AsyncLLM output_handler failed.
(APIServer pid=1) ERROR 04-14 11:57:06 [async_llm.py:693] Traceback (most recent call last):
(APIServer pid=1) ERROR 04-14 11:57:06 [async_llm.py:693] File "/usr/local/lib/python3.10/dist-packages/vllm/v1/engine/async_llm.py", line 649, in output_handler
(APIServer pid=1) ERROR 04-14 11:57:06 [async_llm.py:693] outputs = await engine_core.get_output_async()
(APIServer pid=1) ERROR 04-14 11:57:06 [async_llm.py:693] File "/usr/local/lib/python3.10/dist-packages/vllm/v1/engine/core_client.py", line 894, in get_output_async
(APIServer pid=1) ERROR 04-14 11:57:06 [async_llm.py:693] raise self._format_exception(outputs) from None
(APIServer pid=1) ERROR 04-14 11:57:06 [async_llm.py:693] vllm.v1.engine.exceptions.EngineDeadError: EngineCore encountered an issue. See stack trace (above) for the root cause.
(Worker_TP1 pid=178) INFO 04-14 11:57:06 [multiproc_executor.py:730] Parent process exited, terminating worker
(APIServer pid=1) INFO: 127.0.0.1:43490 - "POST /v1/chat/completions HTTP/1.1" 200 OK
(Worker_TP3 pid=180) INFO 04-14 11:57:06 [multiproc_executor.py:730] Parent process exited, terminating worker
(Worker_TP5 pid=182) INFO 04-14 11:57:06 [multiproc_executor.py:730] Parent process exited, terminating worker
(Worker_TP6 pid=183) INFO 04-14 11:57:07 [multiproc_executor.py:730] Parent process exited, terminating worker
(APIServer pid=1) INFO: Shutting down
(APIServer pid=1) INFO: Waiting for application shutdown.
(APIServer pid=1) INFO: Application shutdown complete.
(APIServer pid=1) INFO: Finished server process [1]
(Worker_TP0 pid=177) WARNING 04-14 11:57:08 [multiproc_executor.py:786] WorkerProc was terminated
(Worker_TP6 pid=183) WARNING 04-14 11:57:09 [multiproc_executor.py:786] WorkerProc was terminated
(Worker_TP7 pid=184) WARNING 04-14 11:57:09 [multiproc_executor.py:786] WorkerProc was terminated
(Worker_TP3 pid=180) WARNING 04-14 11:57:09 [multiproc_executor.py:786] WorkerProc was terminated
(Worker_TP2 pid=179) WARNING 04-14 11:57:09 [multiproc_executor.py:786] WorkerProc was terminated
(Worker_TP1 pid=178) WARNING 04-14 11:57:10 [multiproc_executor.py:786] WorkerProc was terminated
(Worker_TP5 pid=182) WARNING 04-14 11:57:10 [multiproc_executor.py:786] WorkerProc was terminated

请协助指导,谢谢🙏🙏🙏
4/14
全部4条回复
网
网友lQKnJd
1楼
这肯定不正常,CUDA图一般十多秒就完了
4/12
没有更多内容了
--
楼主
Level.1
0 帖子
楼主热帖
暂无数据